Most construction safety reports open with the same numbers: lost time injuries, recordable injuries and the frequency rates that go with them. Those figures matter, but every one of them describes harm that has already happened. By the time a lost time injury shows up in the monthly report, the conditions behind it have often been on site for weeks.
That is why strong safety teams track two kinds of measures side by side. Lagging indicators show the outcome. Leading indicators show whether the work that prevents harm is actually happening.
What are leading and lagging safety indicators?
Lagging indicators measure safety outcomes after the event. They count injuries, incidents and the time lost to them. Common examples are the Lost Time Injury Frequency Rate (LTIFR), the Total Recordable Injury Frequency Rate (TRIFR), lost days and the number of incidents by classification. Frequency rates are usually calculated per million hours worked, although some regions use a base of 200,000 hours, so check which one your client or contract expects.
Leading indicators measure the activities and conditions that reduce the chance of harm before anything goes wrong. Examples include hazards reported and closed out, inspections completed against plan, pre-start and toolbox talk attendance, and workers with current tickets and licences.
A simple way to tell them apart: a lagging indicator tells you what happened, and a leading indicator tells you what you are doing about it.
Why you need both
- Lagging indicators on their own are reactive: a low injury rate can hide weak controls on a site that has simply been lucky.
- Small numbers mislead: on a single project, injuries are thankfully rare, so one incident can swing a frequency rate sharply. Leading indicators generate enough data points to show a real trend.
- Leading indicators show where to act: a drop in hazard reports or a pile of overdue inspection actions is a warning sign you can respond to this week, not next quarter.
- Lagging indicators keep the leading ones honest: if activity is high but people are still getting hurt, the activities are not targeting the real risks.
- Better safety conversations: leading data gives project and site leaders something specific to discuss, rather than a number that only moves after someone is injured.
Common leading and lagging indicators in construction
Leading indicators
- Hazard reporting: hazards raised, and the share closed out by their due date.
- Inspections: inspections completed against plan, plus actions raised and closed.
- Pre-starts and toolbox talks: sessions held per shift or week, and worker attendance.
- Competency: workers with current certificates, and expiring tickets picked up before they lapse.
- Permits: high-risk work, such as hot works or excavation, started only with an approved permit in place.
Lagging indicators
- Frequency rates: LTIFR and TRIFR.
- Severity: lost days and restricted duties.
- Incidents by classification: first aid, medical treatment and lost time injuries.
- Damage incidents: plant and property damage events.
Near misses sit between the two. A near miss is an event that has already happened, but reporting one is a leading behaviour. On most sites, a rising near miss reporting rate is a good sign, because it shows people are speaking up before someone gets hurt.
Common challenges
- Counting activity instead of quality. Fifty inspections that find nothing are not necessarily better than ten that find real issues.
- Tick-box behaviour, where toolbox talks and pre-starts get signed without anyone listening.
- Hazards that are raised but never closed, because nobody tracks the action through to completion.
- Data spread across paper pre-start sheets, spreadsheets, timesheets and email, so rates are calculated late and by hand.
- Inaccurate hours worked. A frequency rate is only as reliable as the hours it is divided by.
- Tracking so many indicators that nobody acts on any of them.
Best practices
- Tie leading indicators to your biggest risks. If working at heights and plant interaction are the main hazards on your project, measure the inspections, permits and pre-starts that control them.
- Measure close-out, not just volume. One hazard closed out with photo evidence is worth more than five left open.
- Set targets for leading indicators and review them every month alongside LTIFR and TRIFR.
- Take hours from the same source every time. Hours recorded in daily diaries give a more reliable base for frequency rates than end-of-month estimates.
- Break results down by company and location to see which crews, subcontractors or work areas need support.
- Make reporting easy and welcome. Treat a rise in hazard and near miss reports as engagement, not failure, and let people report quickly from a phone.
- Read the two sets together. If leading activity is strong and injuries still occur, review whether the activities are aimed at the right risks.
How Glaass Supports Leading and Lagging Safety Indicators
Glaass Pro’s Safety module keeps day-to-day safety activity and the incident record on one platform, so both sets of indicators come from the same data. With Glaass, project teams can:
- Run pre-starts, plant pre-starts and toolbox talks on site, with workers signing on digitally from a phone or tablet.
- Raise hazard reports and safety inspection actions with a responsible person, company and due date, then close them out with photo evidence stamped with name, date and time.
- Track every worker’s tickets, licences and certificates, including issue and expiry dates.
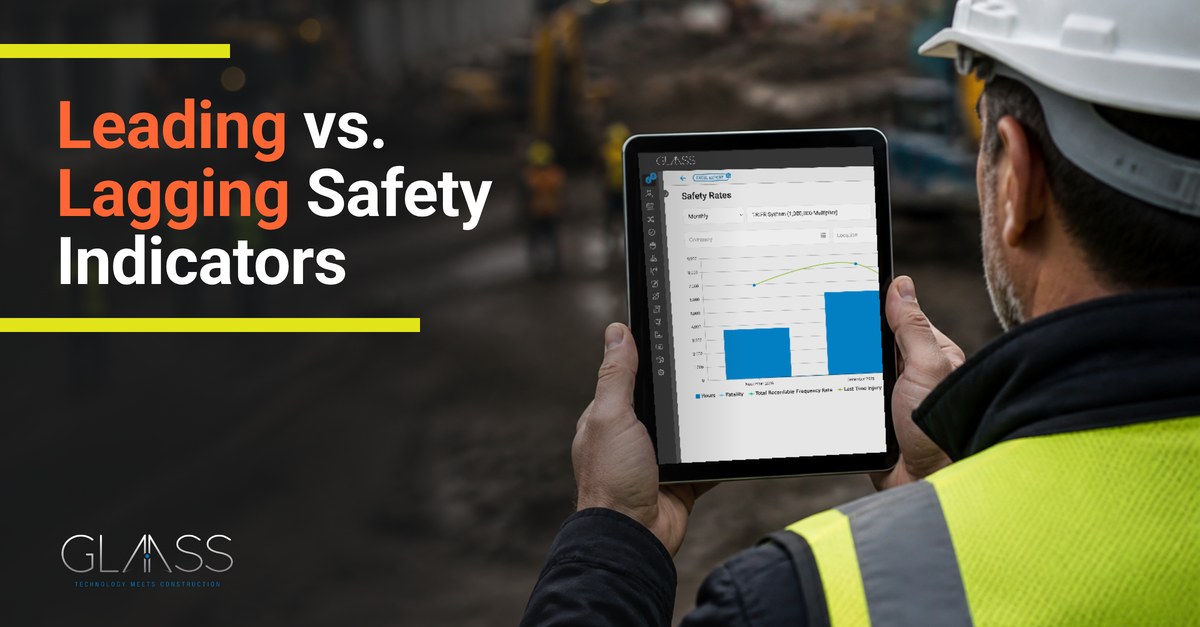
- Classify incidents from near miss to lost time injury, with TRIFR, LTIFR, fatality frequency and lost days rates calculated automatically from daily diary hours and broken down by company, location, workforce and month, in our Safety Rates dashboard.
- Choose whether to use the TRIFR System (1,000,000 Multiplier) or OSHA standard (200,000 Multiplier) when calculating Safety Rates.
- Chart incident trends on dashboards and export safety data to Excel, or to Microsoft Power BI through your own Azure data lake.
Final thoughts
Lagging indicators tell you how a project has performed. Leading indicators tell you whether it is likely to keep performing. Track a short list of both, keep the data in one place, and review them together each month so the conversation is about prevention as well as results.
If your team is still building safety rates from spreadsheets and paper pre-start sheets, it is worth seeing how Glaass connects site activity with incident reporting. You can find out more at glaass.net.
FAQ
What is the difference between leading and lagging safety indicators?
Lagging indicators measure harm that has already happened, such as injuries and lost time. Leading indicators measure the activities that prevent harm, such as inspections, hazard reports and toolbox talks.
Is a near miss a leading or lagging indicator?
A near miss is an event that has already happened, so it is technically a lagging measure. Near miss reporting rates are usually treated as a leading indicator, because more reporting shows people are raising issues before anyone is hurt.
How is LTIFR calculated?
LTIFR is the number of lost time injuries divided by the total hours worked, multiplied by one million. TRIFR uses the same formula with all recordable injuries. Definitions of a recordable injury vary, so confirm what your client or contract requires.
What are good leading indicators for a construction site?
Good choices include hazards reported and closed on time, inspections completed against plan, pre-start and toolbox talk attendance, current worker certifications, and high-risk work started with an approved permit.
How often should safety indicators be reviewed?
Most projects review frequency rates and leading indicators monthly. Open hazard and inspection actions are worth checking weekly, so overdue items are picked up quickly.